
OUR RESEARCH AVAILABLE NOW

Impact Report 2025–26

Knowledgehook's annual report on Short Learning Cycles and mathematics achievement in Ontario's school boards, with case studies from the classrooms where the work is happening.

Open Report Request a briefing for your board
Inside the report

A report for directors of education, superintendents and ministry officials

01 The state of mathematics in Canada Where Ontario and Canadian students stand, drawing on PISA 2025 and national results.
02 How Short Learning Cycles work The four steps, what teachers do in each, and why the cycle runs weekly.
03 Results in Ontario school boards Case studies from partner boards, told with the directors and teachers who led the work.
04 Data and definitions Data sources, definitions and technical notes for research and assessment staff.
FIELD REPORT · 25 SEP 2026Toronto District School Board priority schools, EQAO 2025–26 → FIELD REPORT · 5 DEC 2025Niagara Catholic District School Board, steady gains in math →
1
2
3
4
STEP 3 Targeted intervention
The research behind each step

The research base for each stage of the Short Learning Cycle

For each stage, this page describes its implementation in Knowledgehook, the mechanism through which it supports learning and the studies on which it draws.

01Check for understanding 02Teacher reflection 03Targeted intervention 04Measure growth
How to read the evidence

Interpreting effect sizes

Studies report results as effect sizes, expressed in standard deviations. Figure 1 shows where the average student receiving an intervention would rank relative to a comparable group that did not receive it.

Comparison class With the program

Figure 1. The average student moves from the 50th to the 58th percentile.

STEP 01

Check for understanding

Short, curriculum-aligned checks on one Ontario expectation, given inside regular mathematics class. Every wrong answer choice is written to match a known misconception, so each response shows how a student is thinking.

HOW IT DRIVES LEARNING

Formative assessment raises achievement when teachers use the evidence to change what they teach next. Teachers who know which misconception a student holds can teach to it directly.
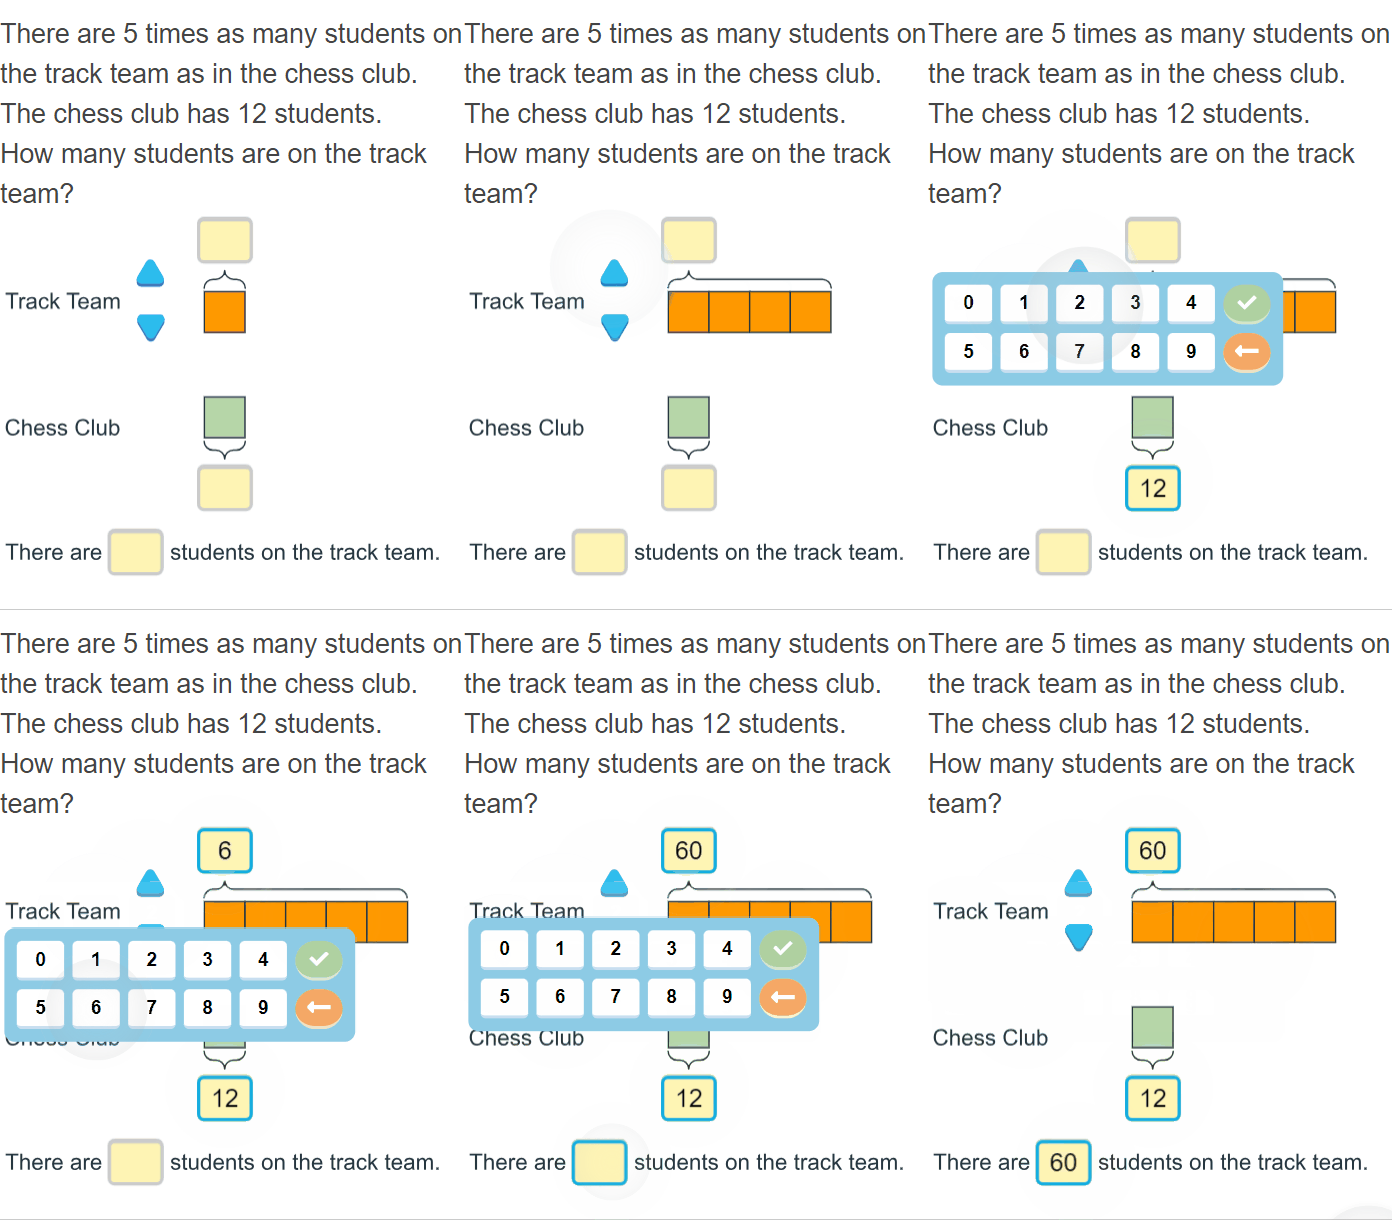
Figure 2. Distribution of responses to a diagnostic item24 OF 24 RESPONSES
Which fraction is larger: 3/8 or 3/5?
A. 3/5 Correct
B. 3/8 Thinks a larger denominator makes a larger fraction
C. They are equal Compares the numerators only
Note: Illustrative class of 24 students.
Knowledgehook Grade 4 question in which a student builds a bar model to solve a multiplicative comparison problem
In practice. A Grade 4 check: students model "4 times as long" with a bar model before answering.
0.20Weighted mean effect of formative assessment across studies. Computer-based formative systems averaged 0.28.Kingston & Nash, 2011
0.79Average effect of feedback across earlier meta-analyses, about twice the average effect of schooling.Hattie & Timperley, 2007
9,556 studentsStudents learned more when teachers could identify the most common wrong answer, compared with teachers who knew only the correct answer.Sadler et al., 2013
Ontario policyThe primary purpose of assessment is to improve student learning, through assessment for learning and as learning.Growing Success, 2010
Sources for this step (8)
Kingston, N., & Nash, B. (2011). Formative assessment: A meta-analysis and a call for research. Educational Measurement: Issues and Practice, 30(4), 28–37. doi.org/10.1111/j.1745-3992.2011.00220.x
Hattie, J., & Timperley, H. (2007). The power of feedback. Review of Educational Research, 77(1), 81–112. doi.org/10.3102/003465430298487
Black, P., & Wiliam, D. (1998). Assessment and classroom learning. Assessment in Education: Principles, Policy & Practice, 5(1), 7–74. doi.org/10.1080/0969595980050102
Wiliam, D., & Thompson, M. (2008). Integrating assessment with learning: What will it take to make it work? In C. A. Dwyer (Ed.), The future of assessment (pp. 53–82). Routledge. doi.org/10.4324/9781315086545-3
Sadler, P. M., Sonnert, G., Coyle, H. P., Cook-Smith, N., & Miller, J. L. (2013). The influence of teachers’ knowledge on student learning in middle school physical science classrooms. American Educational Research Journal, 50(5), 1020–1049. doi.org/10.3102/0002831213477680
Sadler, P. M. (1998). Psychometric models of student conceptions in science. Journal of Research in Science Teaching, 35(3), 265–296. doi.org/10.1002/(SICI)1098-2736(199803)35:3%3C265::AID-TEA3%3E3.0.CO;2-P
Smith, J. P., III, diSessa, A. A., & Roschelle, J. (1994). Misconceptions reconceived. Journal of the Learning Sciences, 3(2), 115–163. doi.org/10.1207/s15327809jls0302_1
Ontario Ministry of Education. (2010). Growing success: Assessment, evaluation, and reporting in Ontario schools. www.ontario.ca/page/growing-success-assessment-evaluation-and-reporting-ontario-schools-kindergarten-grade-12
STEP 02

Teacher reflection

Knowledgehook groups class results into focus areas, names the misconception behind them and gives the teacher a short explanation with practical ways to teach it. The teacher decides what happens next.

HOW IT DRIVES LEARNING

Teachers' knowledge of how students learn mathematics predicts student gains. Professional learning works best when it is tied to the content being taught and to real student work.

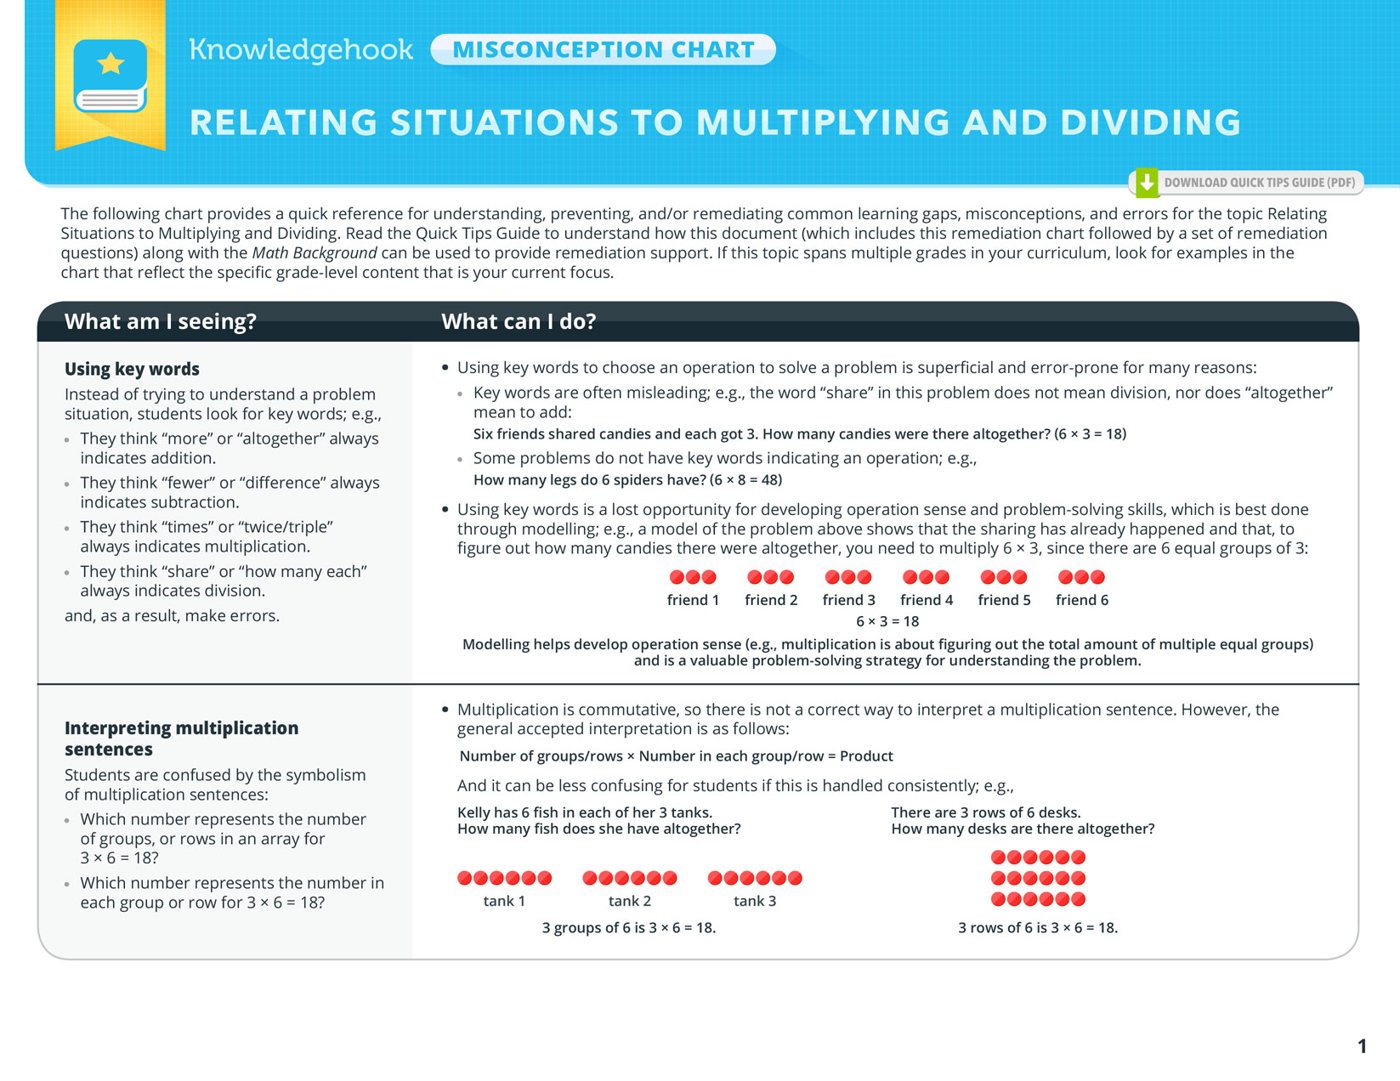
Figure 3. From class results to an instructional decision
Whole classMost of the class shares the gap
Small groupA group of students needs the same support
IndividualA few students need one-to-one follow-up
Illustrative thresholds.
Knowledgehook Focus Areas view showing the share of students struggling in each area, with whole class, small group and individual intervention options
In practice. Focus Areas show the share of a class struggling in each area, with whole-class, small-group and individual options.
Knowledgehook misconception chart for relating situations to multiplying and dividing, listing what the teacher is seeing and what the teacher can do
In practice. A misconception chart pairs "What am I seeing?" with "What can I do?" for each common error.
Grades 1 & 3Teachers' mathematical knowledge for teaching was significantly related to students' achievement gains.Hill, Rowan & Ball, 2005
0.18 SDEffect of teacher coaching on achievement across 60 causal studies, with 0.49 SD on instruction. Effects are smaller in larger programs.Kraft, Blazar & Hogan, 2018
0.21 SDAverage effect of STEM instructional improvement programs, stronger when teachers learn to use curriculum materials and how students learn.Lynch et al., 2019
Sources for this step (5)
Hill, H. C., Rowan, B., & Ball, D. L. (2005). Effects of teachers’ mathematical knowledge for teaching on student achievement. American Educational Research Journal, 42(2), 371–406. doi.org/10.3102/00028312042002371
Ball, D. L., Thames, M. H., & Phelps, G. (2008). Content knowledge for teaching: What makes it special? Journal of Teacher Education, 59(5), 389–407. doi.org/10.1177/0022487108324554
Kraft, M. A., Blazar, D., & Hogan, D. (2018). The effect of teacher coaching on instruction and achievement. Review of Educational Research, 88(4), 547–588. doi.org/10.3102/0034654318759268
Lynch, K., Hill, H. C., Gonzalez, K. E., & Pollard, C. (2019). Strengthening the research base that informs STEM instructional improvement efforts. Educational Evaluation and Policy Analysis, 41(3), 260–293. doi.org/10.3102/0162373719849044
Darling-Hammond, L., Hyler, M. E., & Gardner, M. (2017). Effective teacher professional development. Learning Policy Institute. learningpolicyinstitute.org/product/teacher-prof-dev
STEP 03

Targeted intervention

Students who have not yet mastered the expectation receive focused instruction and practice on that gap, inside class time, with ready-to-use intervention resources for the teacher.

HOW IT DRIVES LEARNING

Mastery learning holds the expectation fixed and varies the support. Corrective instruction on a specific gap, before the class moves on, helps students who were furthest behind the most.

Figure 4. Achievement distributions under different forms of instruction

With mastery learning, the average student scored above about 84 per cent of a conventional class.

Note: Distributions are schematic. Source: Bloom (1984).
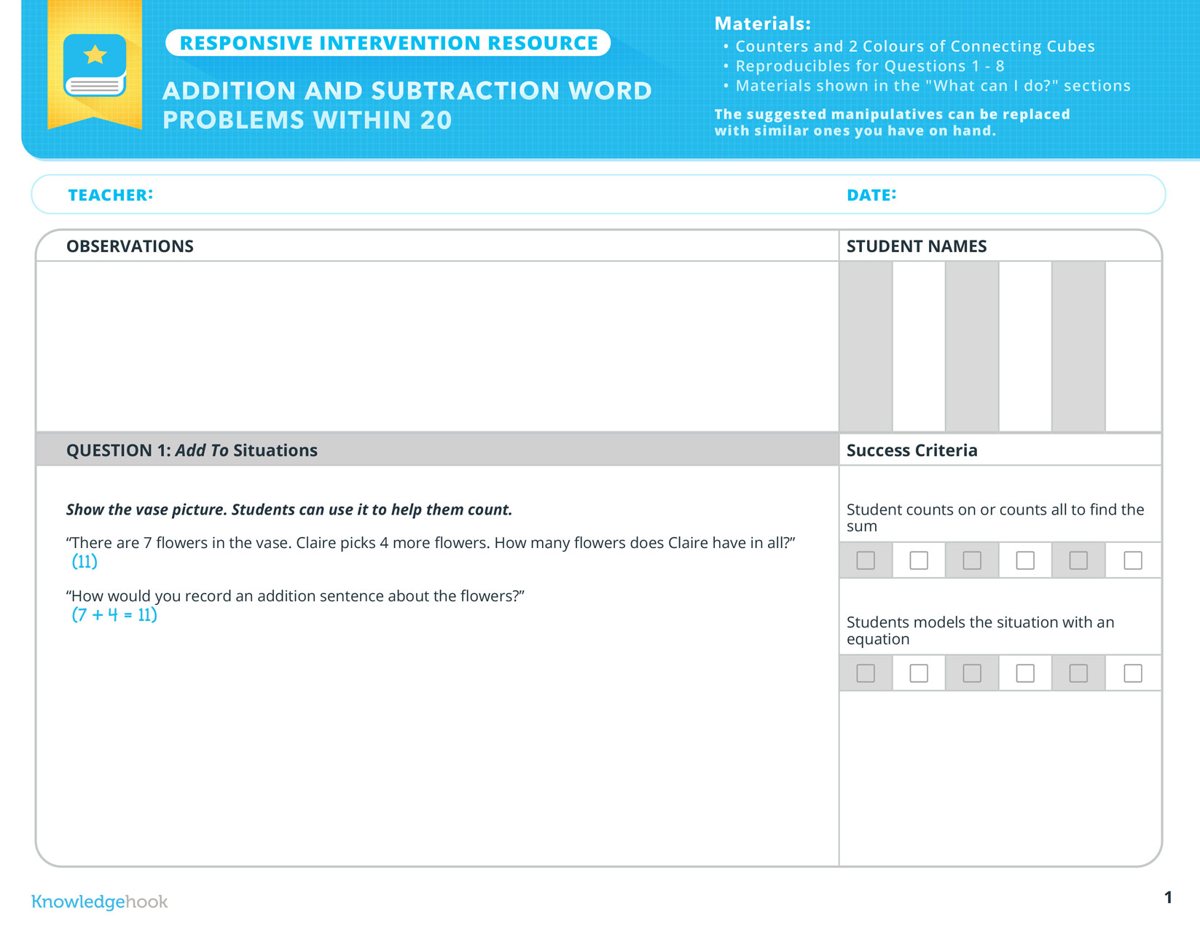
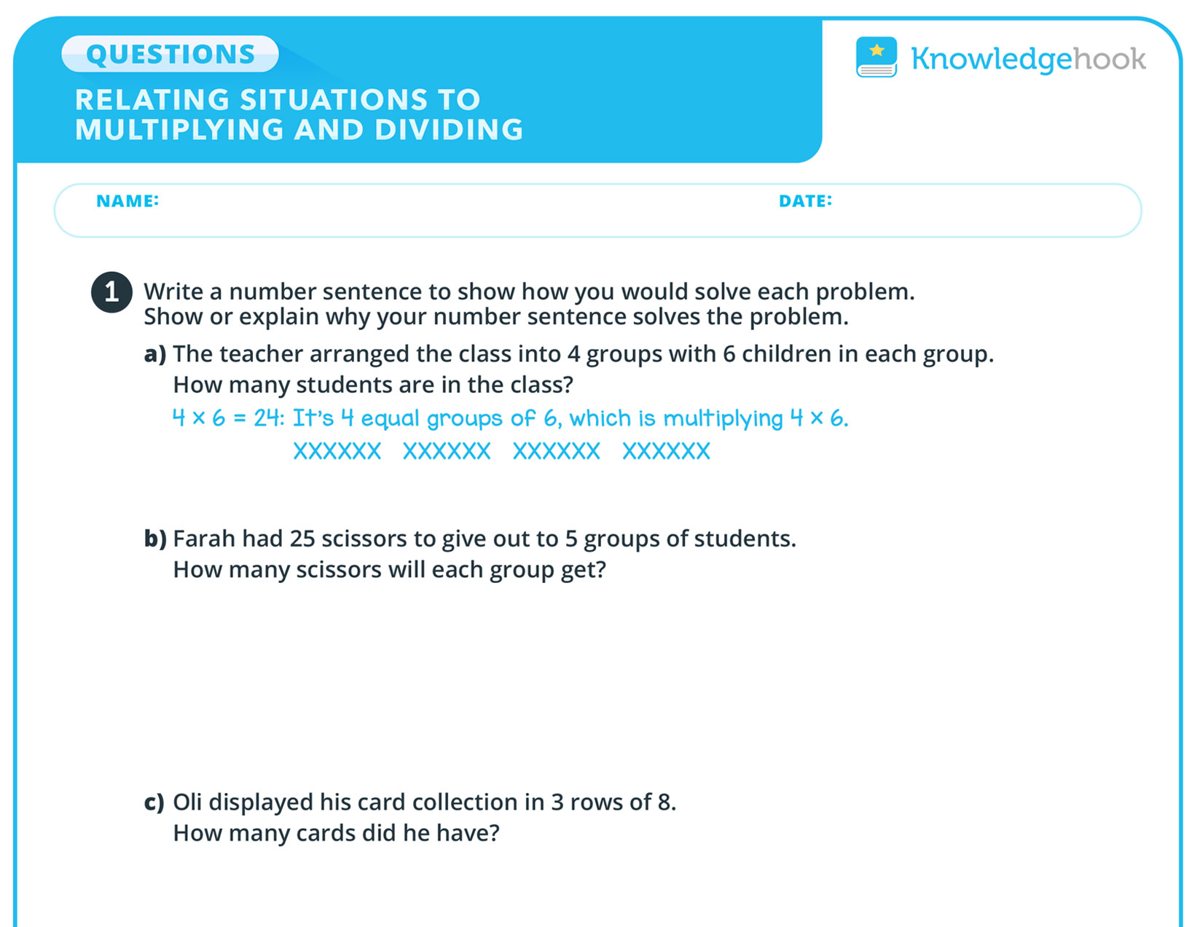
Knowledgehook responsive intervention resource for addition and subtraction word problems within 20, with observation and success criteria columns Knowledgehook intervention question sheet for relating situations to multiplying and dividing
In practice. Responsive intervention resources with observation records, success criteria and targeted questions.
0.52Average effect of mastery learning across 103 studies, with stronger effects for lower-achieving students.Kulik, Kulik & Bangert-Drowns, 1990
1 SDMastery learning moved the average student above about 84 per cent of a conventional class.Bloom, 1984
StrongSystematic, explicit instruction for students who struggle with mathematics carries the highest evidence rating in federal practice guides.Gersten et al., 2009; Fuchs et al., 2021
Sources for this step (5)
Kulik, C.-L. C., Kulik, J. A., & Bangert-Drowns, R. L. (1990). Effectiveness of mastery learning programs: A meta-analysis. Review of Educational Research, 60(2), 265–299. doi.org/10.3102/00346543060002265
Bloom, B. S. (1984). The 2 sigma problem. Educational Researcher, 13(6), 4–16. doi.org/10.3102/0013189X013006004
Guskey, T. R. (2007). Closing achievement gaps: Revisiting Benjamin S. Bloom’s “Learning for Mastery.” Journal of Advanced Academics, 19(1), 8–31. doi.org/10.4219/jaa-2007-704
Fuchs, L. S., et al. (2021). Assisting students struggling with mathematics: Intervention in the elementary grades (WWC 2021006). Institute of Education Sciences. ies.ed.gov/ncee/WWC/Docs/PracticeGuide/WWC2021006-Math-PG.pdf
Gersten, R., et al. (2009). Assisting students struggling with mathematics: Response to Intervention for elementary and middle schools (NCEE 2009-4060). Institute of Education Sciences. ies.ed.gov/ncee/wwc/PracticeGuide/2
STEP 04

Measure growth

Each cycle closes with a follow-up check. The teacher sees who closed the gap, and the cycle record shows how the class is moving across the term.

HOW IT DRIVES LEARNING

Measuring progress raises achievement when teachers act on it. Gains come from clear decision rules that change instruction for students who are not yet progressing.

Figure 5. Share of students demonstrating mastery, by cycleCYCLE 6 OF 8
C1 C2 C3 C4 C5 C6 C7 C8

After cycle 6: 74 per cent of students have mastered the expectations taught so far.

Illustrative class.
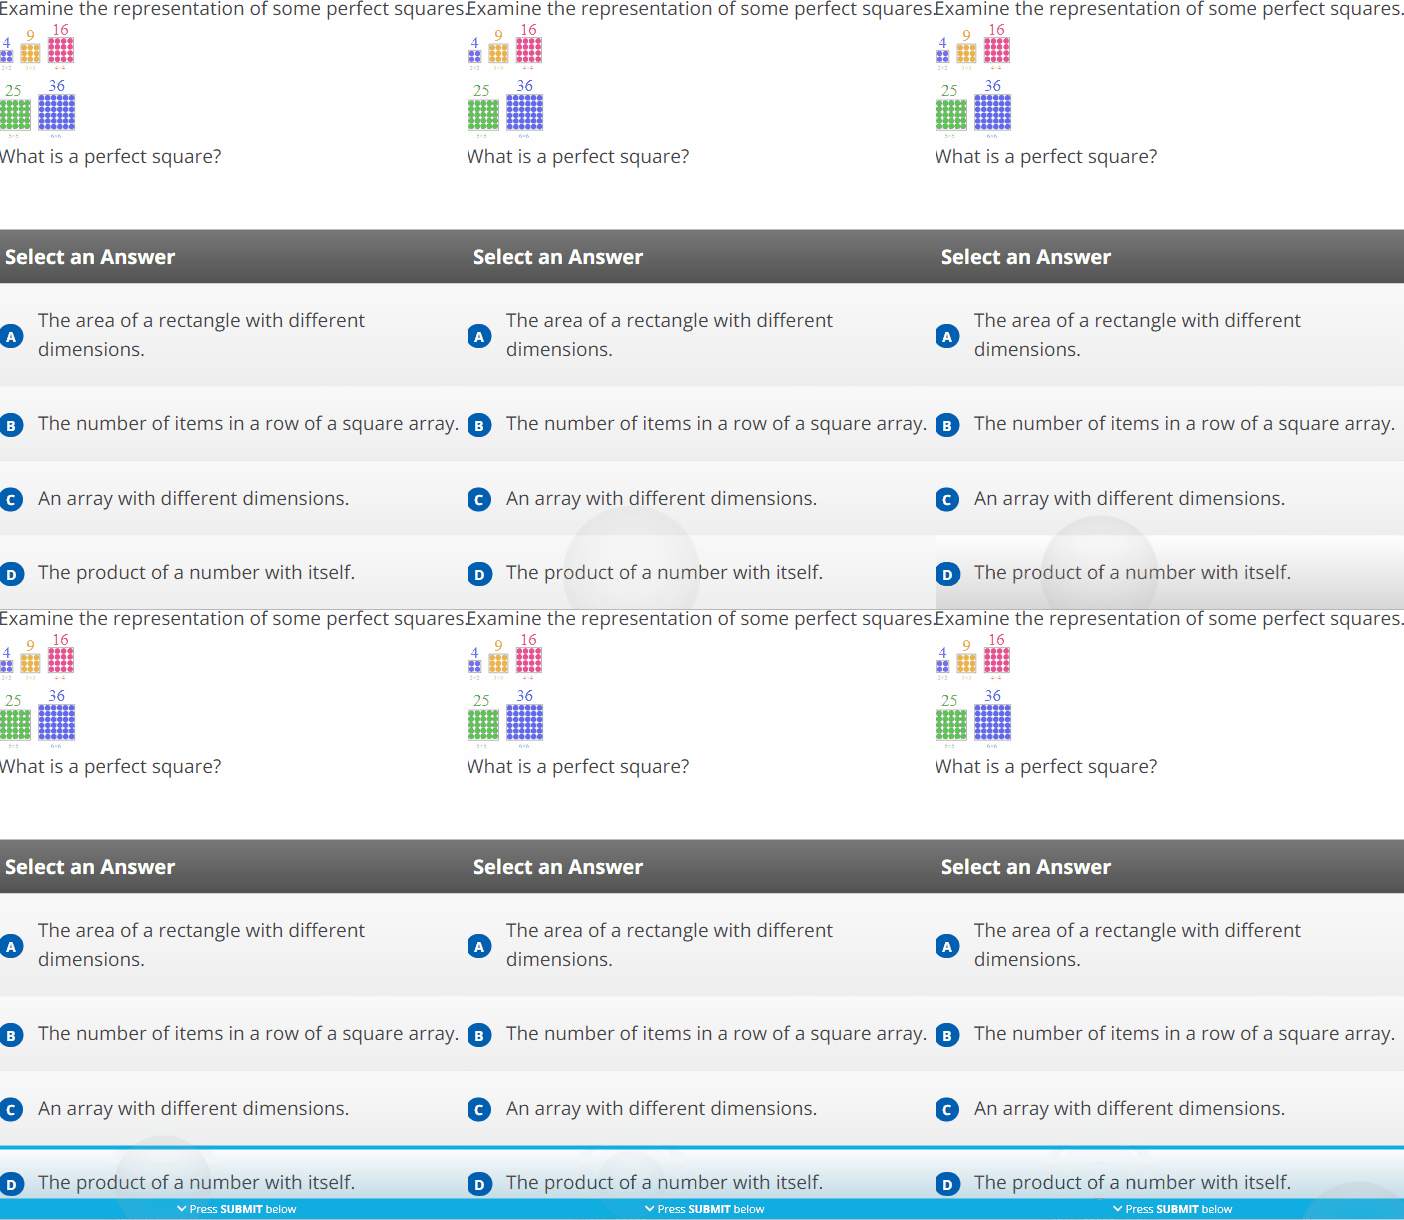
Knowledgehook Grade 8 follow-up question on perfect squares with four answer choices
In practice. A Grade 8 follow-up check on perfect squares closes the cycle.
Act on itProgress monitoring improved achievement when teachers used decision rules and changed instruction in response to the data.Stecker, Fuchs & Fuchs, 2005
0.70Average effect of systematic formative evaluation in special education across 21 studies.Fuchs & Fuchs, 1986
Sources for this step (3)
Stecker, P. M., Fuchs, L. S., & Fuchs, D. (2005). Using curriculum-based measurement to improve student achievement. Psychology in the Schools, 42(8), 795–819. doi.org/10.1002/pits.20113
Fuchs, L. S., & Fuchs, D. (1986). Effects of systematic formative evaluation: A meta-analysis. Exceptional Children, 53(3), 199–208. doi.org/10.1177/001440298605300301
Gersten, R., et al. (2009). Assisting students struggling with mathematics (NCEE 2009-4060), Recommendation 7. ies.ed.gov/ncee/wwc/PracticeGuide/2
BETWEEN CYCLES

Retrieval and mixed practice

Students return to earlier expectations in short, low-stakes sessions that mix problem types and revisit content over weeks.

HOW IT DRIVES LEARNING

Recalling an idea from memory strengthens it more than reviewing it. Mixing problem types teaches students to choose the right method, which is what assessments ask of them.

Figure 6. Accuracy during practice and performance one week later, by type of practice
Accuracy during practice60%
Score on a test one week later63%

Mixed practice produced lower accuracy during the session and substantially higher performance one week later.

Source: Rohrer and Taylor (2007), Experiment 2.
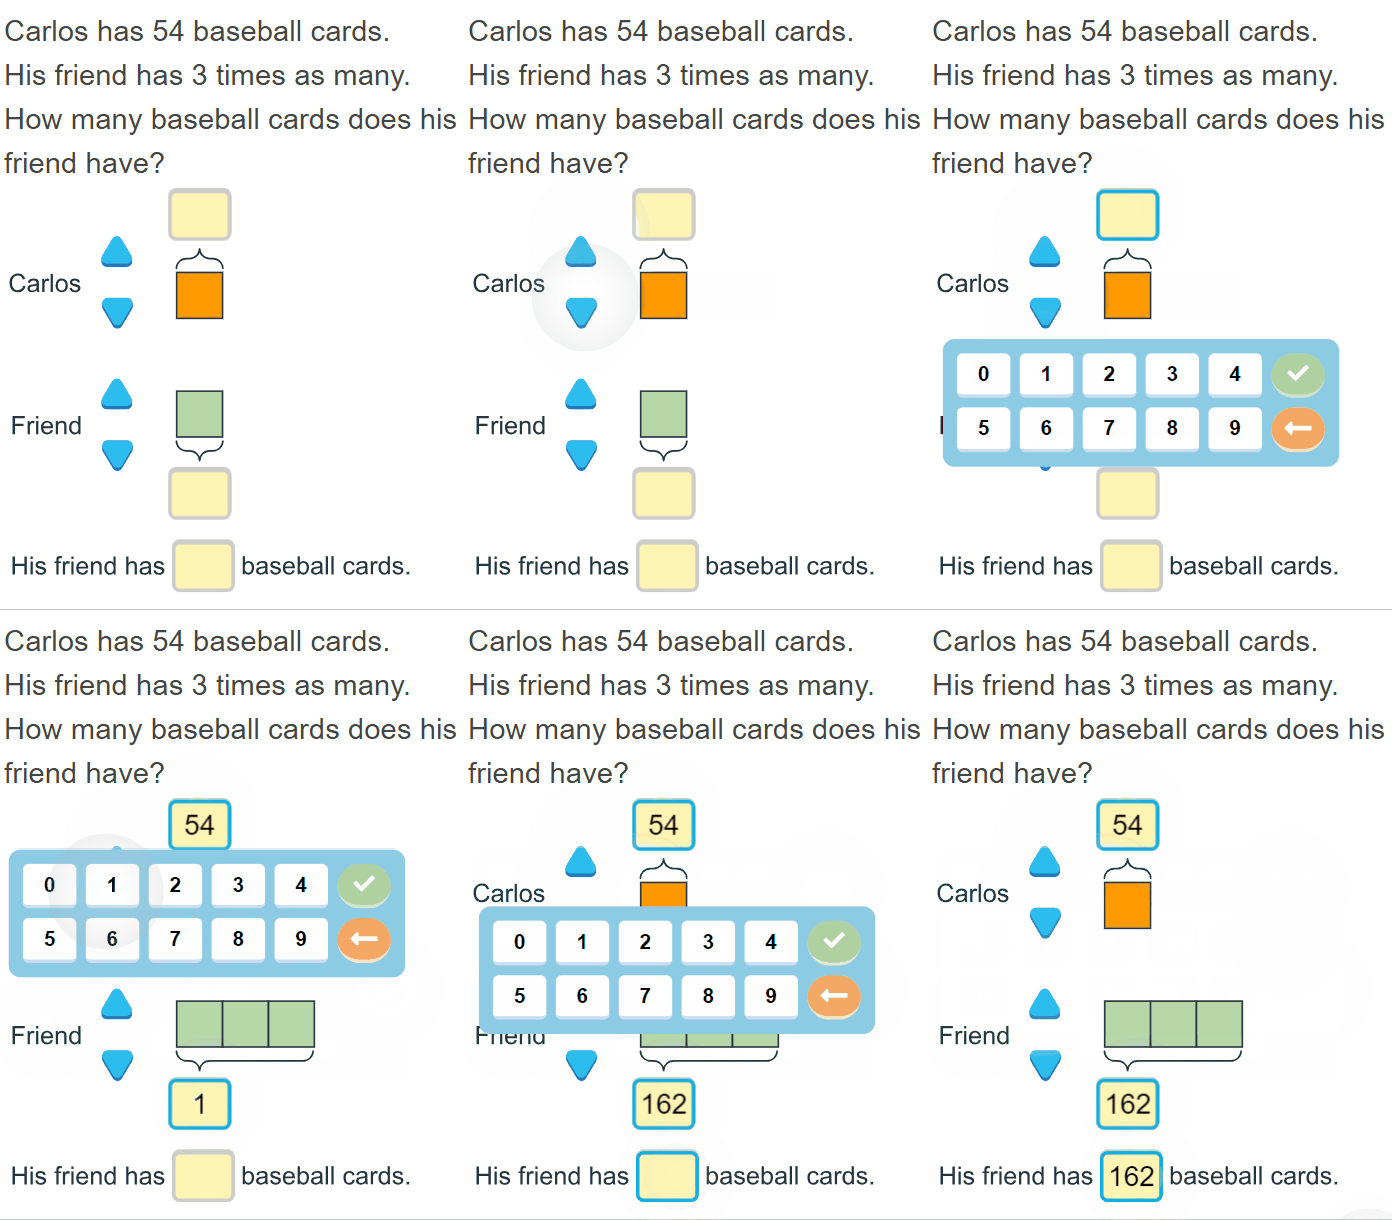
Knowledgehook Grade 4 practice question in which a student builds a bar model for a comparison problem about baseball cards
In practice. Practice revisits the same idea in a new context, so students retrieve the method rather than repeat it.
63% vs 20%Test scores one week after mixed practice compared with blocked practice.Rohrer & Taylor, 2007
High utilityPractice testing and spaced practice were the only two of ten study techniques rated high utility.Dunlosky et al., 2013
57%Share of classroom experiments in which retrieval practice produced medium or large benefits.Agarwal, Nunes & Blunt, 2021
Sources for this step (5)
Rohrer, D., & Taylor, K. (2007). The shuffling of mathematics problems improves learning. Instructional Science, 35(6), 481–498. doi.org/10.1007/s11251-007-9015-8
Dunlosky, J., Rawson, K. A., Marsh, E. J., Nathan, M. J., & Willingham, D. T. (2013). Improving students’ learning with effective learning techniques. Psychological Science in the Public Interest, 14(1), 4–58. doi.org/10.1177/1529100612453266
Agarwal, P. K., Nunes, L. D., & Blunt, J. R. (2021). Retrieval practice consistently benefits student learning. Educational Psychology Review, 33(4), 1409–1453. doi.org/10.1007/s10648-021-09595-9
Roediger, H. L., III, & Karpicke, J. D. (2006). Test-enhanced learning. Psychological Science, 17(3), 249–255. doi.org/10.1111/j.1467-9280.2006.01693.x
Clark, D. B., Tanner-Smith, E. E., & Killingsworth, S. S. (2016). Digital games, design, and learning: A systematic review and meta-analysis. Review of Educational Research, 86(1), 79–122. doi.org/10.3102/0034654315582065
ACROSS THE SYSTEM

System view

Directors, superintendents and ministry teams see where cycles are running and which expectations students find hardest, school by school, during the year.

HOW IT DRIVES LEARNING

Achievement data helps a system when it feeds a regular cycle of instructional improvement, so leaders can direct coaching and resources while it still matters.

Figure 7. Short Learning Cycles completed across a school board, by weekWEEK 8 OF 12
Fewer cyclesMore cycles
Note: Illustrative board of 48 schools.
Knowledgehook Focus Areas view displayed on a desktop screen
From the product. Focus areas roll up from classrooms to schools.
59 districtsA randomized trial of district-wide data-driven reform across seven states found a positive effect on mathematics achievement after one year.Carlson, Borman & Robinson, 2011
Ongoing cycleFederal guidance recommends making data part of an ongoing cycle of instructional improvement.Hamilton et al., 2009
Sources for this section (2)
Carlson, D., Borman, G. D., & Robinson, M. (2011). A multistate district-level cluster randomized trial of the impact of data-driven reform on reading and mathematics achievement. Educational Evaluation and Policy Analysis, 33(3), 378–398. doi.org/10.3102/0162373711412765
Hamilton, L., et al. (2009). Using student achievement data to support instructional decision making (NCEE 2009-4067). Institute of Education Sciences. ies.ed.gov/ncee/wwc/PracticeGuide/12
WHY THE CYCLE RUNS WEEKLY

Early gaps in understanding constrain later learning

Elementary knowledge of fractions predicts high school algebra years later. Closing a gap inside the unit costs far less than repairing it after the next units have been taught.

A gap in fractions, left unaddressed GRADE 4 TO HIGH SCHOOL
GRADE 4–6Fractions
GRADE 6–7Ratios and rates
GRADE 7–8Proportional reasoning
GRADE 8–9Linear relations
HIGH SCHOOLAlgebra

Each later topic depends on the one before it, so the gap carries forward into algebra.

5–6 yearsElementary knowledge of fractions and division predicted high school algebra and overall mathematics achievement, after controlling for IQ, working memory and family background.Siegler et al., 2012
FoundationalProficiency with fractions is foundational for algebra and should be a major goal of K–8 mathematics.National Mathematics Advisory Panel, 2008
Sources for this section (2)
Siegler, R. S., et al. (2012). Early predictors of high school mathematics achievement. Psychological Science, 23(7), 691–697. doi.org/10.1177/0956797612440101
National Mathematics Advisory Panel. (2008). Foundations for success. U.S. Department of Education. files.eric.ed.gov/fulltext/ED500486.pdf

Frequently asked questions

Knowledgehook works inside core mathematics instruction. Teachers run Short Learning Cycles on the Ontario expectations they are already teaching, so the cycle adds evidence and support to existing lessons rather than separate time.

Receive the Impact Report 2025–26

View the report and arrange a briefing for your board's leadership team.

Open Report