
Students who play more Knowledgehook games complete more questions.
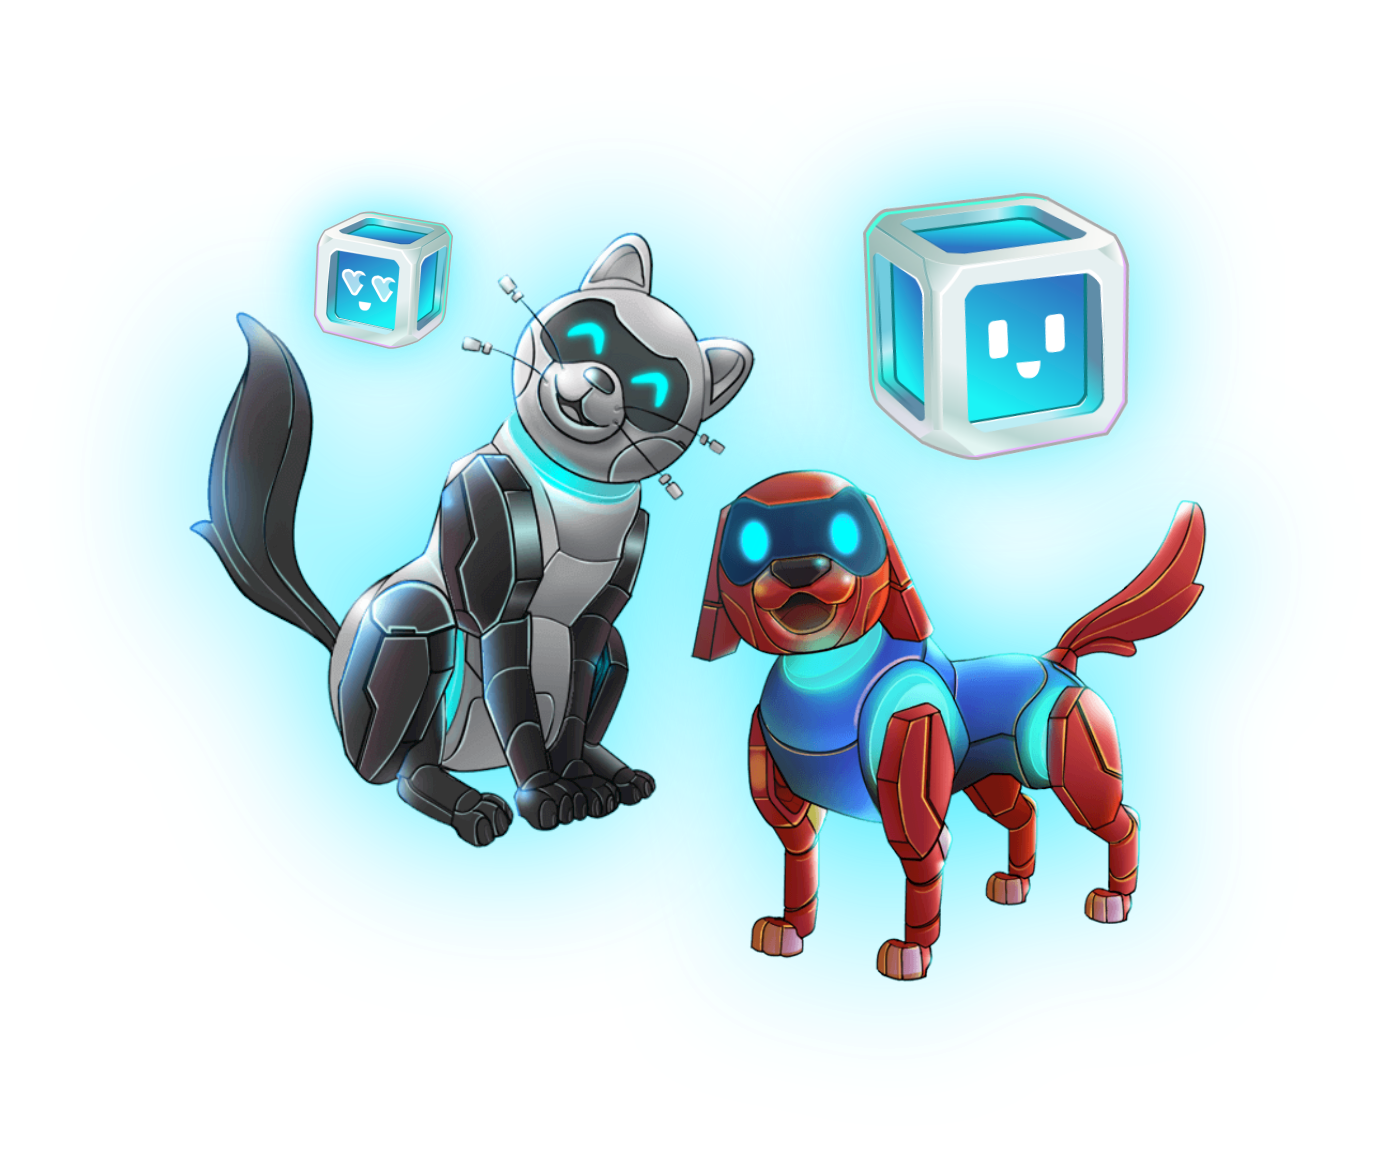
Among school year 2025 students, every gaming engagement student tier answers more than the tier below it.
25+ game events vs. no games
The engagement ladder

Assignment volume does rise with higher game engagement: 30.8 missions assigned with no game events versus 65.5 in the 25+ group, inferring an increase in question requests based on the amount of game events. But answers rise faster: 7.8 answers per assigned mission with no game events, versus 19.4 in the 25+ group.
Completion of assigned missions also climbs, from 30% to 50%. The pattern is not only “those classes got more homework.” The 12% of students who play produce roughly 32% of all answers.
| Gaming engagement | Students | Avg game events | Median answers | Avg answers | Missions assigned | Missions completed | % completing | % requesting missions |
|---|---|---|---|---|---|---|---|---|
| No game activity | 757,459 | 0 | 114 | 239.9 | 30.79 | 9.29 | 76.74% | 0.92% |
| One game event | 16,024 | 1 | 411 | 587.7 | 51.29 | 19.71 | 90.26% | 12.13% |
| 2–4 game events | 29,809 | 2.8 | 447 | 640.0 | 53.58 | 21.29 | 90.65% | 17.14% |
| 5–9 game events | 21,989 | 6.7 | 522 | 731.0 | 56.02 | 23.18 | 91.26% | 26.04% |
| 10–24 game events | 21,379 | 15.3 | 634 | 864.5 | 59.37 | 25.90 | 92.33% | 37.37% |
| 25+ game events | 17,283 | 73.4 | 945 | 1,273.0 | 65.50 | 32.41 | 93.42% | 56.52% |
Zooming out

| Segment | Students | Median answers | Missions completed | Mission or assignment requesting % |
|---|---|---|---|---|
| Played or visited a game | 106,484 | 558 | 24.17 | 28.67% |
| Game character world hub, no play | 31,028 | 398 | 19.20 | 17.09% |
| No gaming engagement | 256,230 | 29 | 2.03 | 0.10% |
Bringing it all together
Motivation drives question completion, so you get the insights you need.
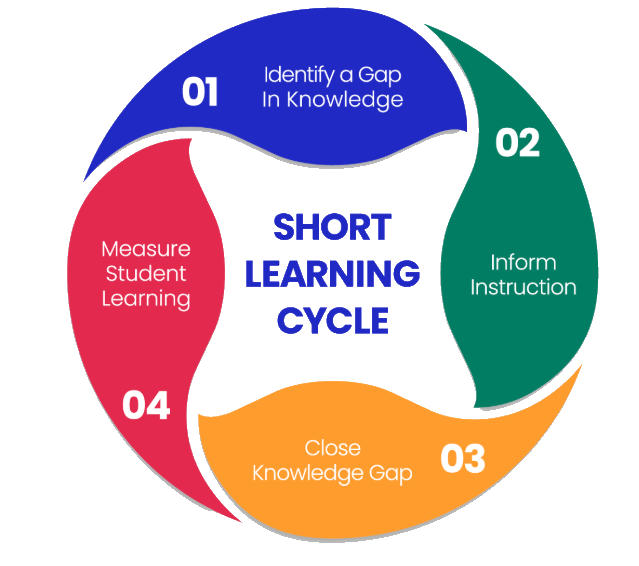
 Driven by game engagement

